For practice owners running Dentally

“I can’t believe those are the numbers.”

It is the sentence we hear most often, usually in the first ten minutes, and it is not because a figure is wrong. They are the practice’s own figures, straight out of its own Dentally. It is that giving a holistic view was never what Dentally was built to do.

Running a seven-figure business without a clear view of what is happening inside it is a hard job, and harder still if you are busy seeing patients. Analytically gives you that view, whether you run one practice or sixty.

First month free, no card required · Set up in minutes · Use it once as a free health check, or stay in control from £120 a month

The gap

Where do you go to find out how the business is doing?

Dentally does what you would expect a practice management system to do. What it does not do is offer much insight into the questions you find yourself asking at the end of a month.

Those questions do have answers, and the answers are already in your own data. They are simply spread across a hundred places and gathered onto no single screen, and it takes effort to pull together the data for even a monthly picture of what is happening.

DentallyBooks the appointment
DentallyRecords the treatment
DentallyRaises the invoice and takes the payment
AnalyticallyShows whether the month landed where you wanted it
AnalyticallyShows which patients have quietly stopped coming
AnalyticallyShows what each chair and each clinician actually earns
AnalyticallyPoints you at the people worth a call this morning

Quick walkthrough

What does it actually show you?

Have you ever not known where to start?

Every headline number your practice has, on one board, each against a target you set and can adjust, so the amber ones find you rather than the other way round. One practice or the whole group, combined or in isolation, in whatever shape your organisation actually has.

It covers the whole revenue picture, including a calculation of the plan income Dentally never surfaces. It separates what the practice keeps from what it billed, because associates work on their own terms and those terms decide what is left behind. And every operational figure opens into a checkable list of names and phone numbers rather than stopping at a headline.

So the board does not start you anywhere in particular. It shows you where starting would be most useful.
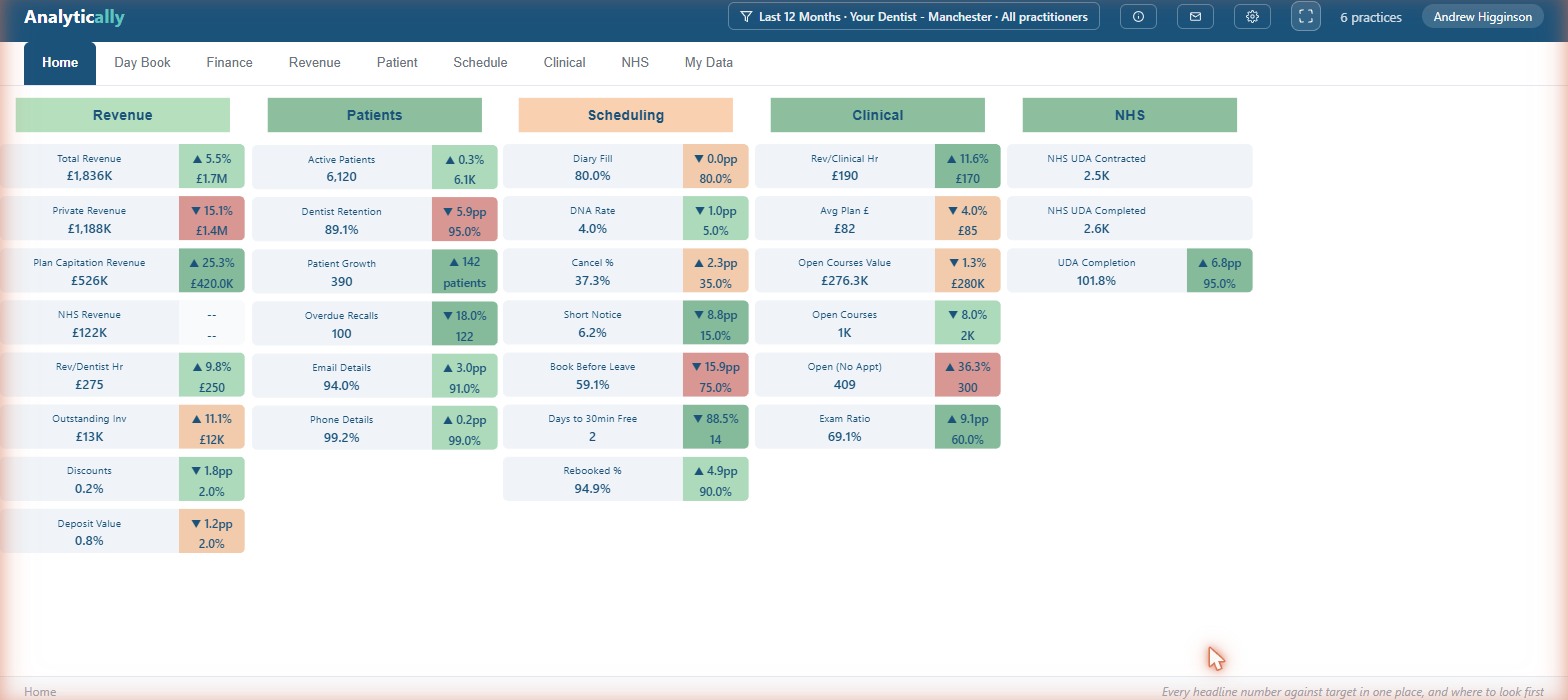
The Analytically home board for one practice: five columns of tiles for Revenue, Patients, Scheduling, Clinical and NHS. Each tile shows a value, the variance against target and the target itself, shaded green, amber or red. 1 2 3 4
  • 1Private revenue £1,188K, down 15.1%. Alarming on its own. Read it with the tile below it, plan income up 25.3%, and total revenue is up 5.5%.
  • 2Dentist retention 89.1% against 95%. One patient in nine not coming back, which on this list is roughly 670 people a year, leaving quietly.
  • 3Book before you leave 59.1% against 75%. Four patients in ten walk out of the building with nothing in the diary. It is the cheapest number on this board to move.
  • 4Open courses with no appointment: 409. Treatment started, paid for in part, and not booked to finish. That is money already on the table.

A demonstration practice. Your own board looks like this within 24 hours of connecting.
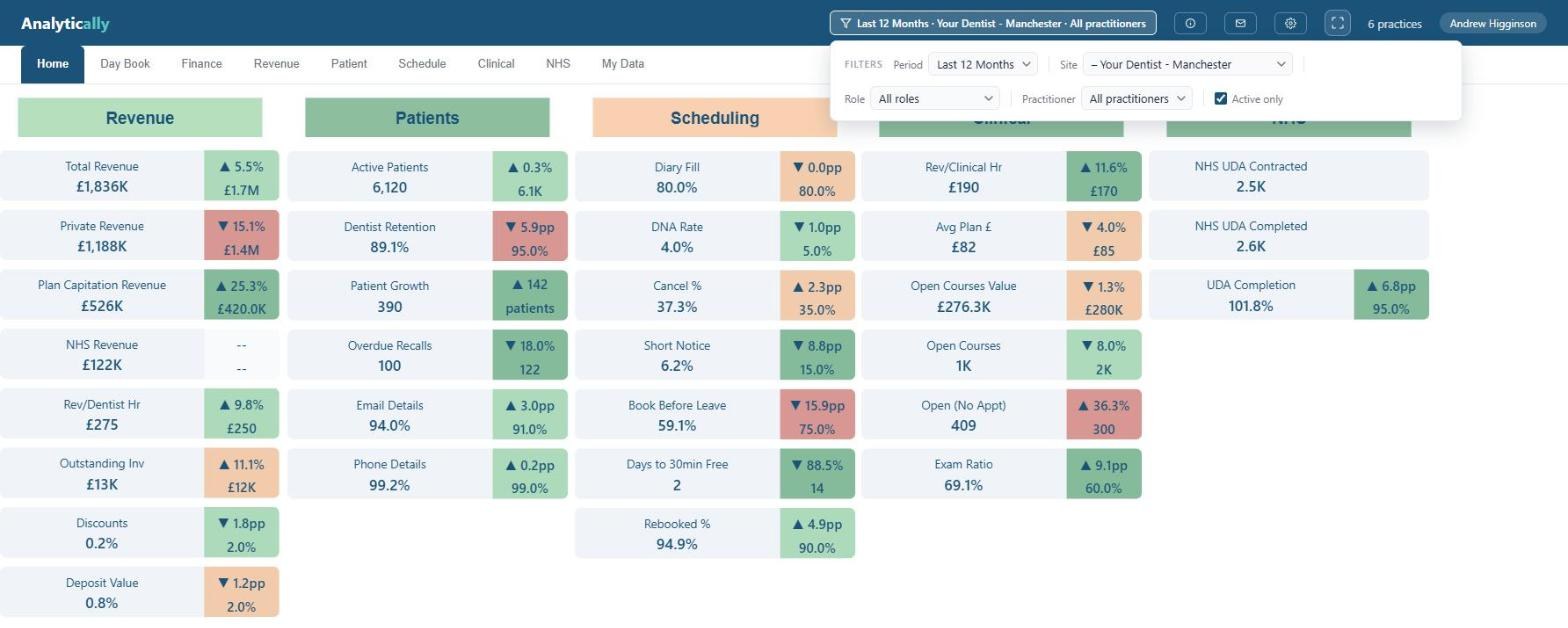
Can I look at just one part of it?

Every view carries the same filter along the top, and changing it re-answers the whole page. Practice, site, role, practitioner, and whichever period you want to look through: the last three months, the last twelve, or the financial year so far.

Roles are yours to define. They arrive set up along the obvious lines, but you can cut them however your practice actually works, so that people doing similar work are compared with each other rather than with a practice average that describes nobody.

Which is what makes a figure answerable. A number for the whole practice says only that something has moved. The same number for one role, over one quarter, says where.

The home board with the filter panel open over it, showing four controls: Period set to Last 12 Months, Site set to one practice chosen from the organisation hierarchy, Role set to all roles, and Practitioner set to all practitioners, with an Active only checkbox. 1 2 3 4
  • 1The period. Everything on the page re-answers for the last three months, the last twelve, or the financial year so far.
  • 2The site, picked out of your own hierarchy, so one practice can be looked at on its own or as part of what it belongs to.
  • 3Role. Comparing an associate with an associate is a conversation; comparing one with a practice average is not.
  • 4One practitioner, or all of them. The filter follows you from view to view, so a question asked of revenue can be asked of scheduling without setting it up again.

A demonstration practice.

What about plan income, Dentally doesn’t show that?

It doesn’t, and that matters more than it first sounds. The plan provider collects the money, so it never arrives in Dentally as a payment at all.

So all the dashboard numbers would be useless! Not slightly out, but describing a different business from the one you are running, and a year-end set of accounts says so nine months late.

What we do about it is hold each plan’s capitation rate, and Dentally hold the patients on it, so plan income is calculated month by month and sits beside private and NHS revenue in the same view, per practitioner and per site. Underneath the total, the same screen breaks the week down by treatment category, so you can see which work is earning and where the mix is moving.

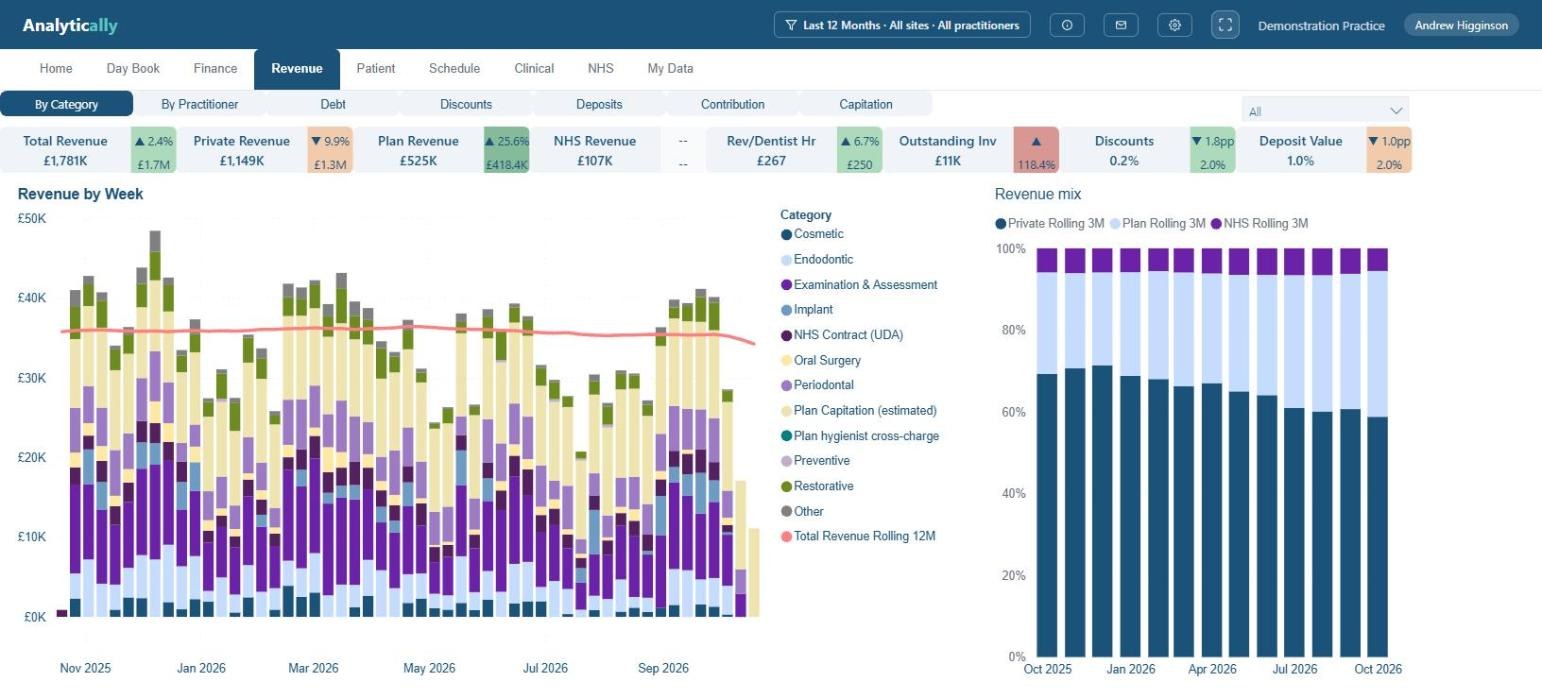
Revenue page: a KPI strip with total, private and plan revenue against target, weekly revenue stacked by treatment category, and a rolling revenue mix chart showing private income falling as plan income rises.
  • 1What the practice can see. Private revenue £1,149K, down 9.9%.
  • 2What it cannot. Plan capitation £525K, up 25.6%.
  • 3Together: £1,781K, up 2.4%. A different business from the one the first number describes.
  • 4The mix column is the point in one picture: private falling from about 70% of revenue to 60% while plan income rises to meet it. Thirteen months, one direction.

The longer version of this argument is in the blind spot in dental practice accounts.

What is left after the associates are paid?

Revenue per associate shows you who is busy. What it does not show is what the practice is left with once they have been paid.

So you set each associate’s share once, configurable in the app (it defaults to 50%).

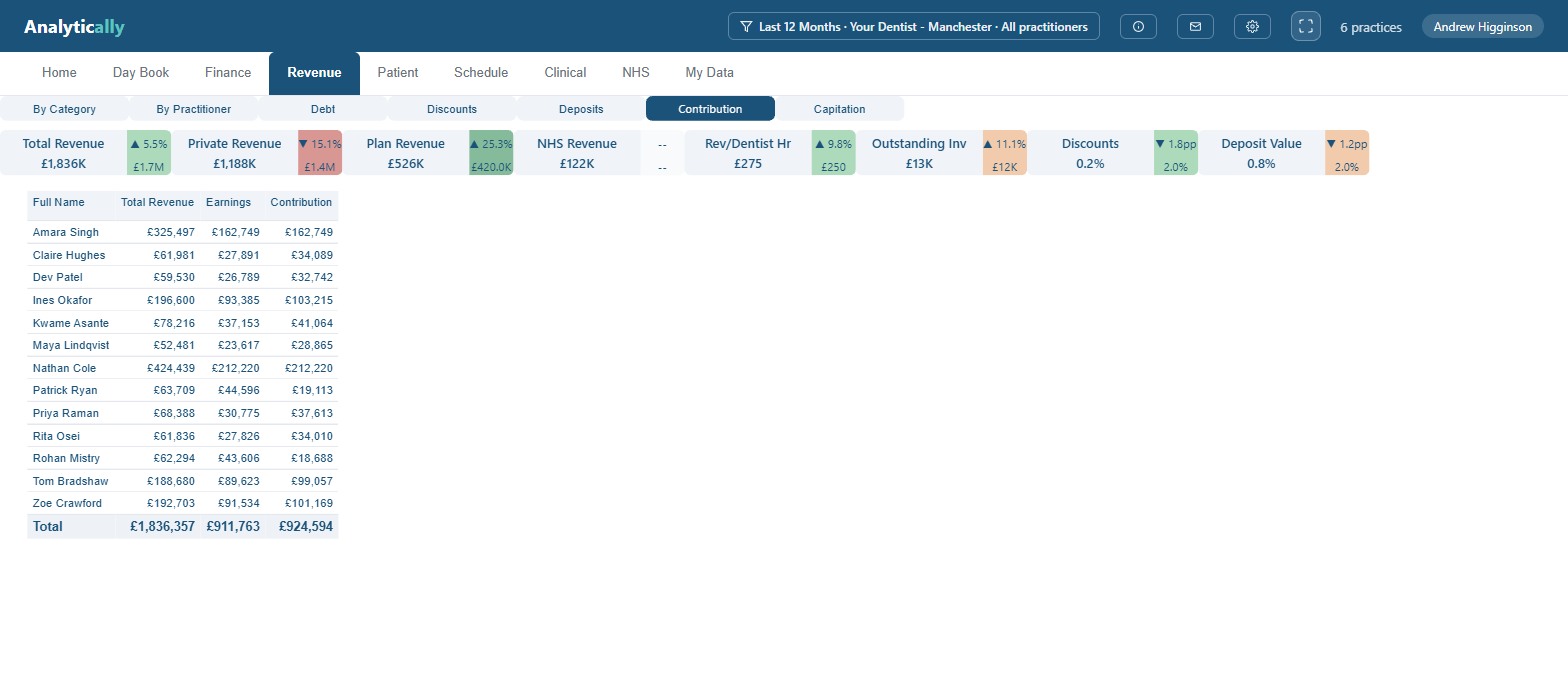
Revenue, Contribution view: a table of every clinician in the practice with three columns for total revenue, earnings and contribution, and a total row showing what was billed, what was paid out to fee-earners and what the practice retained. 1 2
  • 1One associate: billed £325,497, of which the practice keeps £162,749. An even split, which is where the app starts.
  • 2The row an accountant asks for: £1,836,357 billed, £911,763 paid out to fee-earners, £924,594 kept by the practice.
  •  The biggest biller is not automatically the biggest contributor. Here the top earner is both, but that is a fact to check rather than to assume.

A demonstration practice.

Would your associates recognise their own numbers?

Associates are given freedom, and mostly that is right. Occasionally what they need is direction, and that conversation goes better with a screen than with an impression.

Each clinician can be given their own page and nothing else: their revenue, revenue per clinical hour, chair utilisation, diary fill, days to their next free slot, and their open courses, each against their own target rather than the practice’s. It costs £24 a month per clinician, and it takes the guesswork out of an appraisal.

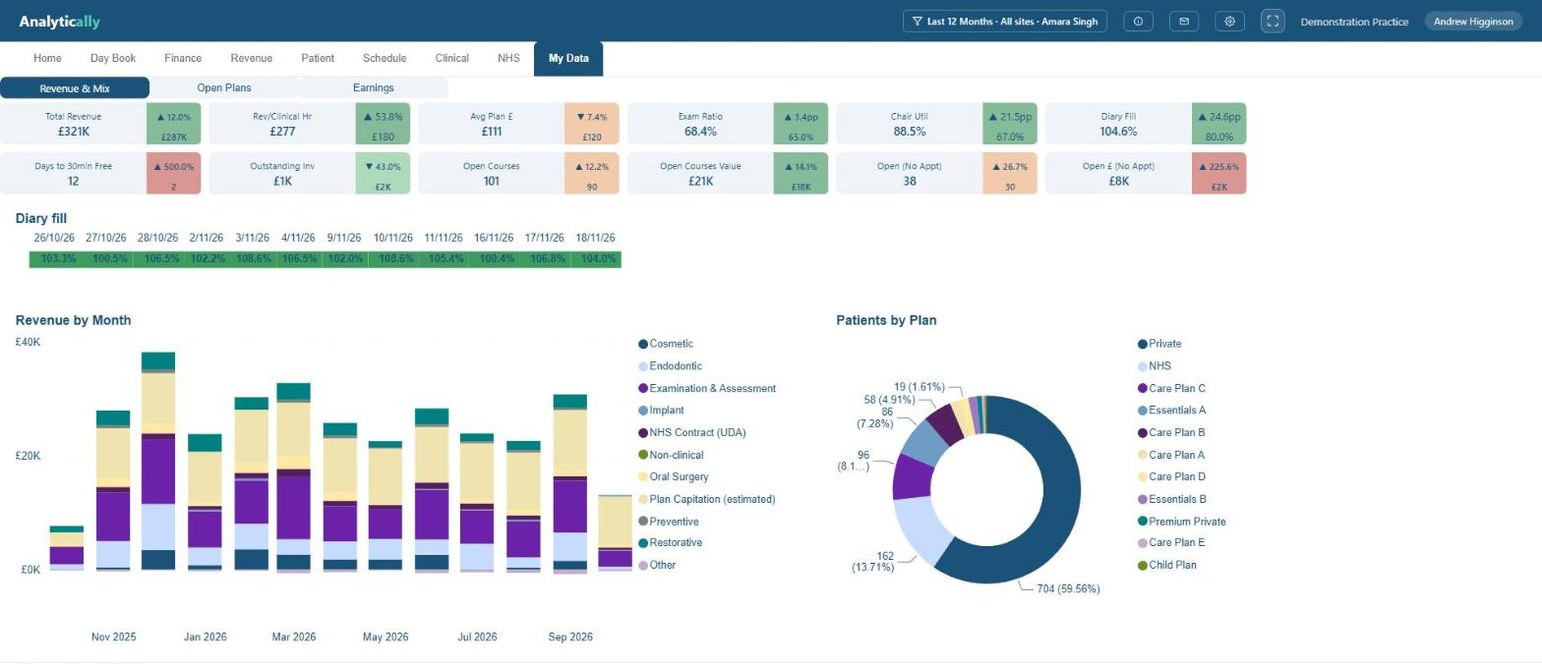
A single associate's own page: revenue, revenue per clinical hour, chair utilisation, diary fill, days to the next half-hour slot, and open courses with and without a booked appointment, each shown against that practitioner's own target.
  • 1One practitioner, their figures only, against the targets agreed with them.
  • 2Revenue per clinical hour separates a busy day from a profitable one. It is the number most worth discussing and the hardest to work out by hand.
  • 3Open courses with and without an appointment, so the conversation is about work to finish rather than effort to make.
  • 4Days until their next free slot: the difference between a clinician who is full and one who looks it.

What if I have more than one practice?

Then you describe your organisation once, sites inside practices, practices inside areas, areas inside regions, and every level becomes selectable on the same board. Nothing is re-keyed and there is no second report.

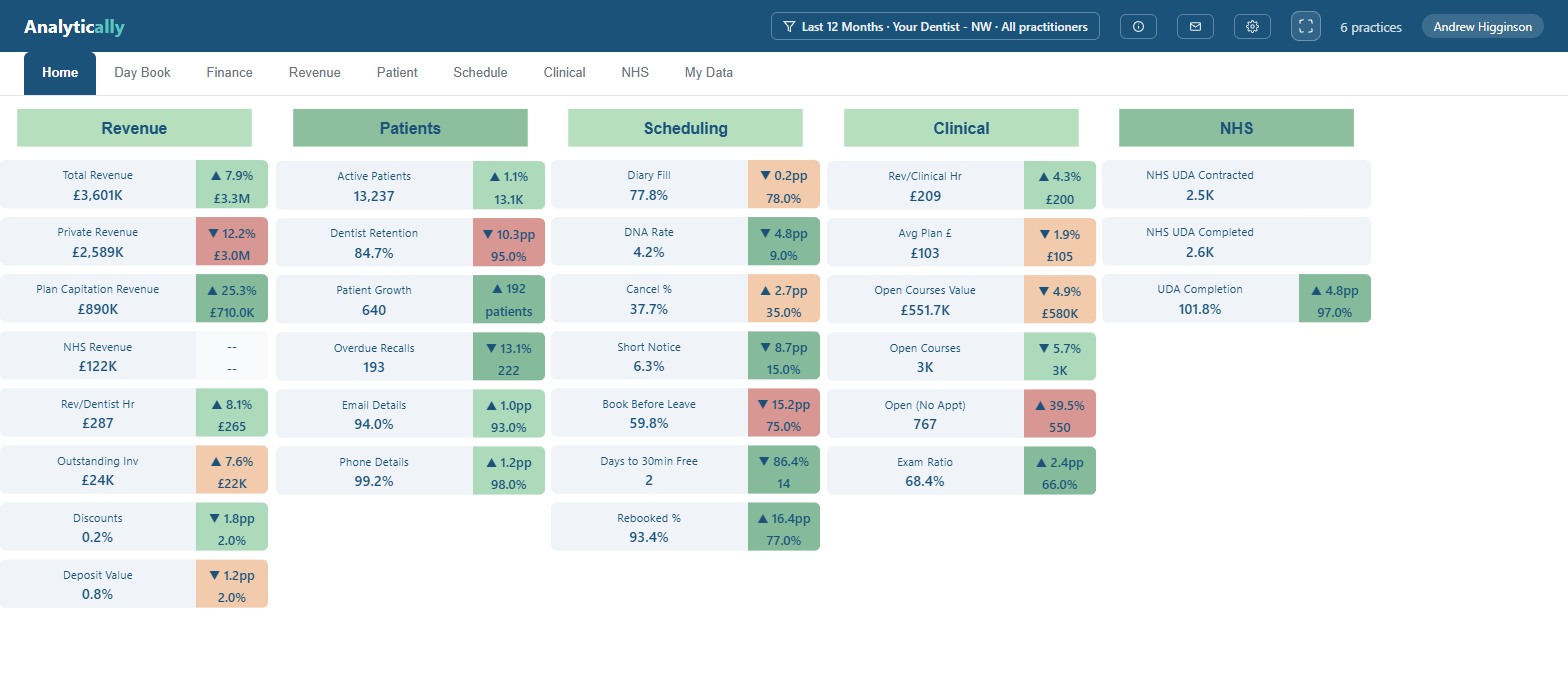
The same home board one level up, showing an area of two practices combined, with the same tiles and targets as the single-practice view. 1 2 3
  • 1Two practices on one line: £3,601K and 13,237 patients between them.
  • 2Retention reads 84.7% at the area against 89.1% at the practice, so the other one is the weaker of the two.
  • 3Open courses with no appointment: 767 across the pair. The target rolls up with the figure, so the comparison stays honest at every level.

The same demonstration group, at area level.

So I can see a problem, how do I know how to fix it?

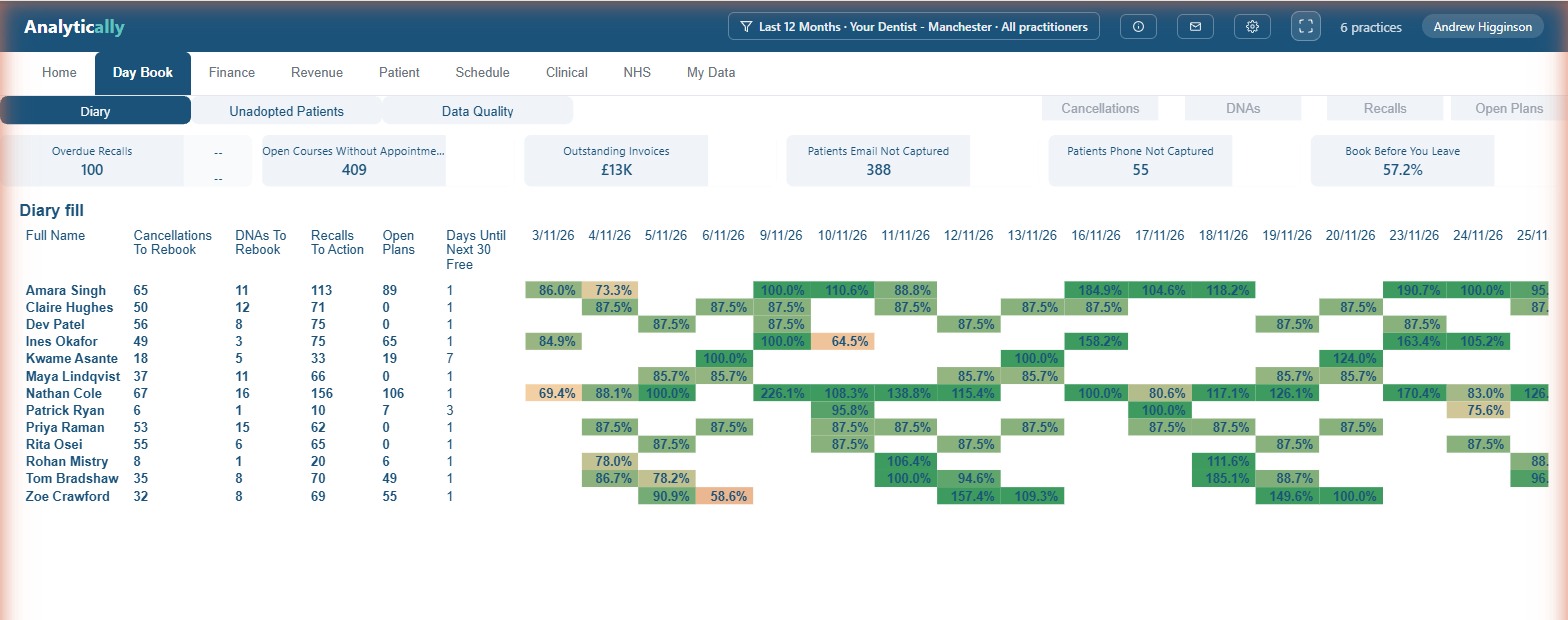
The Day Book is where insights can be actioned, and it is aimed at reception and support staff rather than at the owner. Where the board shows that something has moved, this turns it into lists somebody can pick up and work through this morning.

Cancellations and DNAs to rebook. Open courses of treatment waiting on an appointment to finish them. Recalls that went out and were never taken up. Each opens into the patients behind it, with their contact details, so the front desk gets a morning’s work rather than a statistic.

It also reads per clinician, which is where the shape of a problem usually shows, and where you can see which associates could do with more support. Beside the lists, the diary-fill map runs out across the coming weeks, clinician by clinician.

The Day Book diary view: a strip of counts for overdue recalls, open courses without appointment, outstanding invoices and missing contact details, above a table of every clinician with cancellations to rebook, DNAs, recalls to action and open plans, and a diary-fill heat map across the coming weeks. 1 2 3 4
  • 1409 open courses with no appointment, and 388 patients with no email on file, which is why some of them were never chased.
  • 2One clinician is carrying 156 recalls to action and 106 open plans; another has 10 and 7. The backlog has a shape, and it is a rota problem.
  • 3The amber days are the ones to work on. Zoe Crawford at 58.6% and Ines Okafor at 64.5% have room in the coming weeks that somebody could still fill, which is a better use of an afternoon than chasing the clinician who is already full.
  • 4Cancellations, DNAs, recalls and open plans each open into the list of patients behind them.

A demonstration practice.

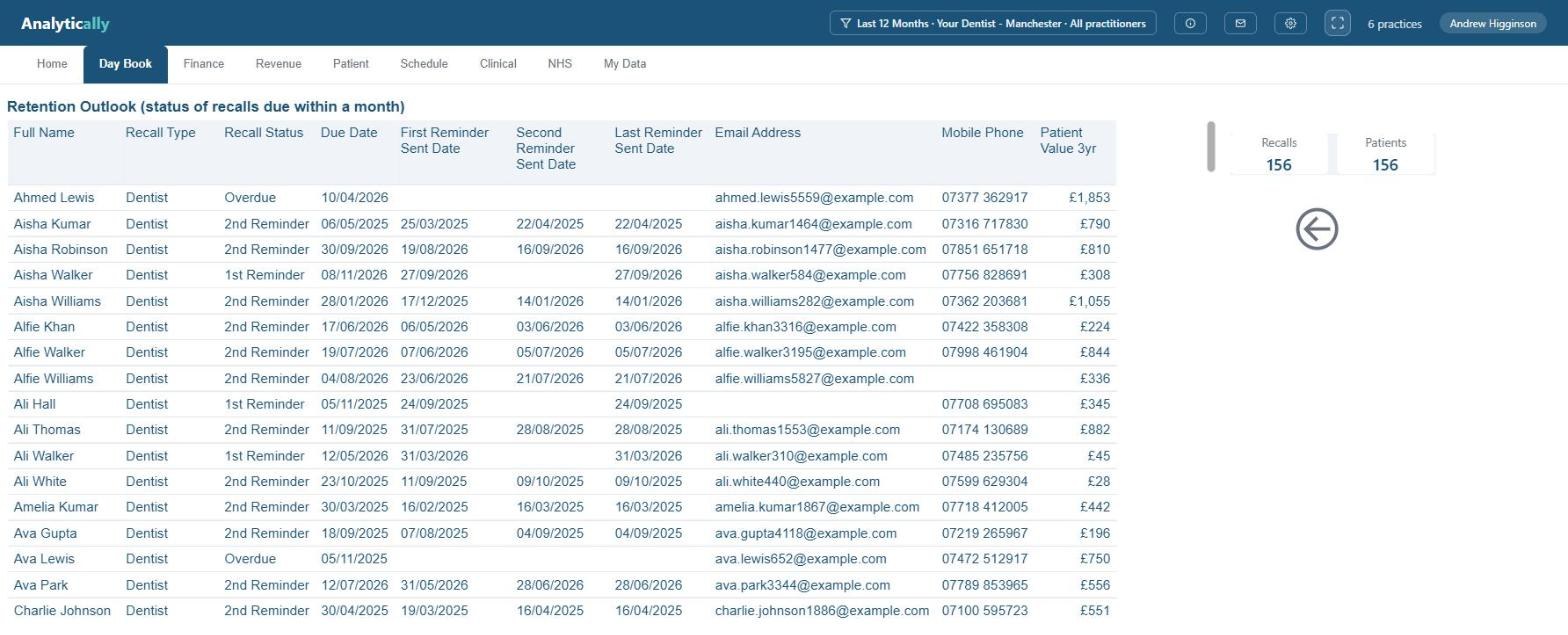
The recall drill-down: a table of named patients with recall type, status, due date, the dates each reminder was sent, email address, mobile number and the patient's three-year value, beside a count showing the clinician's one hundred and fifty-six recalls. 1 2 3
  • 1The email address and mobile number are already beside the name, so nobody has to go back into Dentally to look one up.
  • 2What each patient has been worth over three years, so a long list can be worked in the order that pays.
  • 3One clinician’s recalls, opened from their row on the screen above. The reminder columns show who has already been chased, and how often.

A demonstration practice. The patient names, email addresses and phone numbers are invented.

Targeted visualisations

Would you use a report you had to work out first?

Probably not, and nor would your practice manager. So every view carries its own purpose along the bottom of the breadcrumb: one sentence, visible while you are looking at it, saying what this screen is for and what to do about what it shows.

These are some:

Home Every headline number against target in one place, and where to look first
Revenue › Contribution See what the practice keeps rather than what it bills, once pay and cross-charges come out
Revenue › Capitation See plan income Dentally never records, by month, plan and practitioner
Revenue › Discounts See what is being given away, by whom, and whether it is buying anything
Patient › Lapsing See where you are losing patients, and improve the processes that cause the leaks
Patient › Acquisition See where new patients come from and what they are worth, then spend where it works
Scheduling › Availability See the gaps in the coming weeks while there is still time to fill them
Scheduling › BBYL See who left without booking again, and call them while the visit is fresh
Clinical › Revenue See revenue per clinical hour, so a busy day and a profitable one can be told apart
Clinical › Open Courses See treatment started and not finished, ageing, and get it booked in
NHS See UDA delivery against contract with the year still running, not after it closes
Day Book › Data Quality See the records holding the numbers back, and fix the ones that cost you most

Between them they take on the questions that are hard to ask of a diary. Which patients stopped coming, and when did they last come in? Where did the new ones come from, and were they worth it? Which gaps in next month could still be filled?

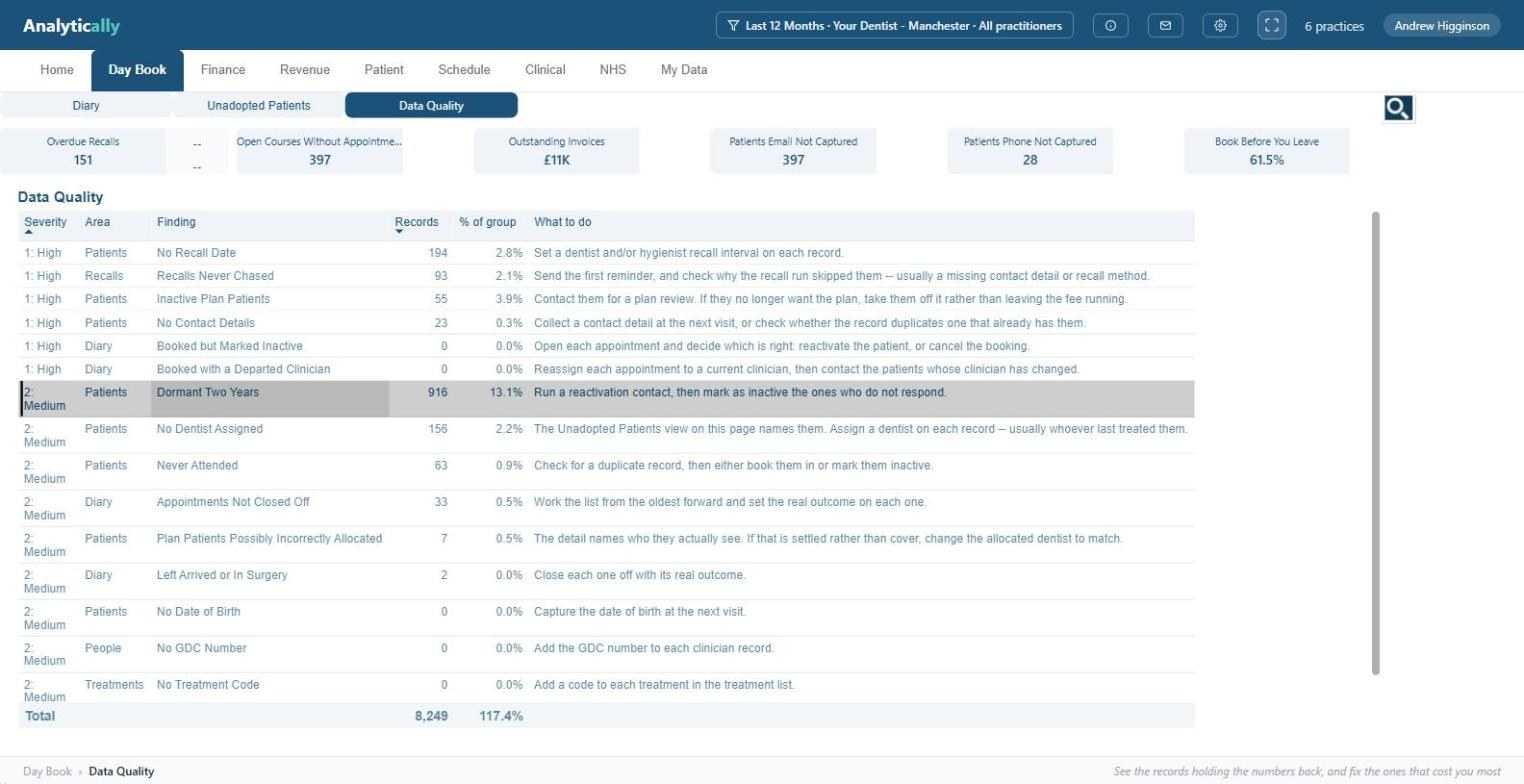
The last one in that list matters more than it sounds. The app also grades the data itself: recalls that were never chased, patients with no recall date, patients who have not been in for two years, appointments still booked with a clinician who has left. Fix those and every other number becomes more honest.

The Data Quality scorecard: a table of checks, each with a severity, the area it affects, the finding, how many records it covers, what share of the group that is, and a sentence saying what to do about it. 1 2 3
  • 1How many records each check covers and what share of the group that is, beside a severity, so the list arrives in the order worth working.
  • 2A sentence per finding saying what to do about it. None of it needs interpreting before somebody can act on it.
  • 3And along the bottom, the purpose line, doing on this screen exactly what this section describes.

Pricing

Who actually needs a login?

You decide, and you are never charged for one you have not switched on. Most practices put the owner and the business manager or practice manager on full access, then add the clinicians who want their own numbers.

Every practice has one primary account, at £120 a month. That is the person who owns the subscription and the only one who can end it. They get full access, and the £120 stands in place of the package price below. Everyone you add after that pays the package price.

Full access
£60 /month

Every report, every practitioner, all settings and targets. What an owner, business manager or practice manager needs.

Clinician
£24 /month

Their own numbers only: revenue, treatment mix, plan values, retention. Useful at appraisal time, and it takes the guesswork out of the conversation.

Front office
£6 /month

The day book: cancellations to rebook, recalls to chase, DNAs, open plans. The working lists, not the financials.

All prices include VAT · First month free, no card required · You are never charged for a login you have not switched on

Larger organisation? A site licence charges one fixed monthly price for the whole group instead of a price per person, set according to its size. Ask us for a price.

Trust

What does it hold about your patients?

No clinical content

No notes, medical histories, correspondence, documents or images. No NHS numbers, ethnicity or addresses. We hold names, contact details and the operational figures, and nothing we do not need.

Inactive means invisible

Once a patient is inactive, their identifying data is removed from the platform automatically. They remain in your history as a number, not as a person.

UK-hosted, per-practice isolation

Microsoft Azure UK South. Row-level security means one practice’s data is unreachable from another’s, enforced by the database rather than by the application.

Documented, not asserted

Security overview, data processing agreement, sub-processor register, privacy notice and cookie policy: written down and available to read before you sign anything.

Questions

The ones we get asked first.

How long does it take to set up?

You connect it to Dentally and your own board is filled within 24 hours. There is nothing to install, and nothing to tidy up in Dentally first.

Does it change anything in Dentally?

Nothing. The connection only ever reads. Analytically never writes an appointment, a note or a patient record back.

Can my associates see each other’s numbers?

Only if you give them full access. A clinician login shows that clinician’s own figures against their own targets, and nothing else.

What does it cost?

One primary account at £120 a month, with full access. After that it is £60 for another full-access user, £24 for a clinician and £6 for a front-office login. All include VAT, and you are never charged for a login you have not switched on.

Do I need a card to try it?

No. The first month is free and takes no card. Use it once as a health check and walk away if it is not for you.

Does it work if I have more than one practice?

Yes. You describe your organisation once and every level, from a single site up to the whole group, becomes selectable on the same board.

Would you like to see your own numbers?

Connect in a few minutes and the board fills with your own practice, not a demo and not sample data. The first month is free, there is no card, and there is nothing to uninstall if you walk away.

Start your free month →