Your client runs a multi-million-pound business between patients
They trained as a clinician. Nobody trained them to run this, and nobody gave them the instruments, so they run it on whatever numbers they happen to be handed, between appointments. The difficulty is not that those numbers are wrong. It is that they are individually correct and routinely point the wrong way.
The argument, in four lines
Private billing is down 7% (but the practice is fine).
The diary is under-filled (but filling it fully would block the ability to do timely treatments).
Rebooking at the desk is improving (but expect more cancellations, especially when clinicians take leave).
The best associate in the practice in terms of revenue could also be the one giving the worst patient experience.
Every one of those is correct. Every one read on its own could be acted on in the wrong way. That is not a reporting failure; it is what running a dental practice is. You need to see where you are hurting and, as you fix it, anticipate the knock-on effects.
If your clients run Dentally, a practice can be reading its own figures within 24 hours. Nothing to pay to look, no card and no commitment. A subscription after that costs about twenty minutes of chair time a month.
01
Half the income isn’t in the system they are reading
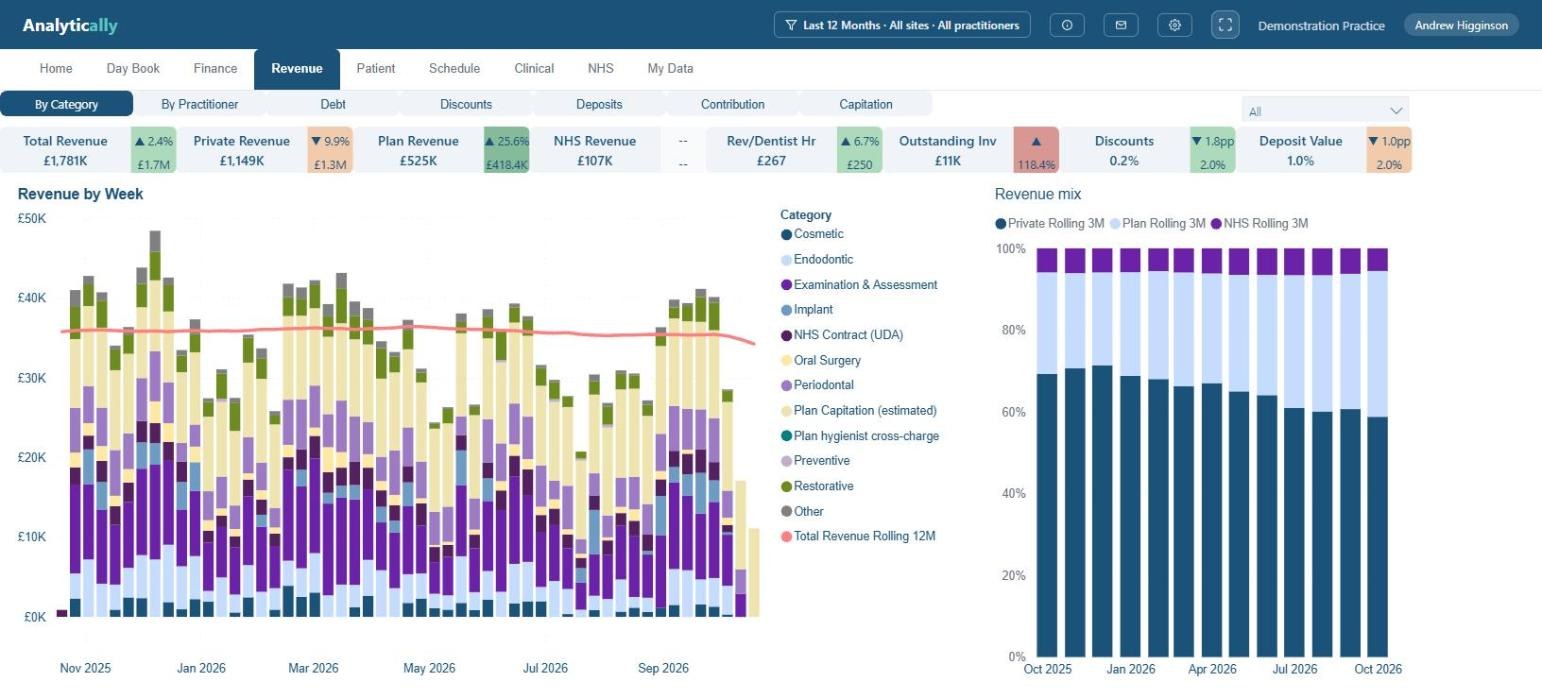
This practice’s private revenue is £1,149K, down 9.9% against target. In Dentally, that is the whole story.
In reality this is offset by plan income being up 25.6%, and Dentally does not record it at all, because the plan provider collects it. So a practice that has been converting patients onto monthly plans appears in its own clinical system as a business in decline. Total revenue is up 2.4%. The income has changed shape rather than shrunk, and a year-end set of accounts shows that nine months late.
1234
1What the practice sees. Private revenue £1,149K, −9.9%.
2What it doesn’t. Plan capitation £525K, +25.6%.
3Together: £1,781K, +2.4%.
4The mix column is the point in one picture, private falling from roughly 70% of revenue to 60% while plan income rises to meet it. Thirteen months, one direction.
02
So where does that plan number come from?
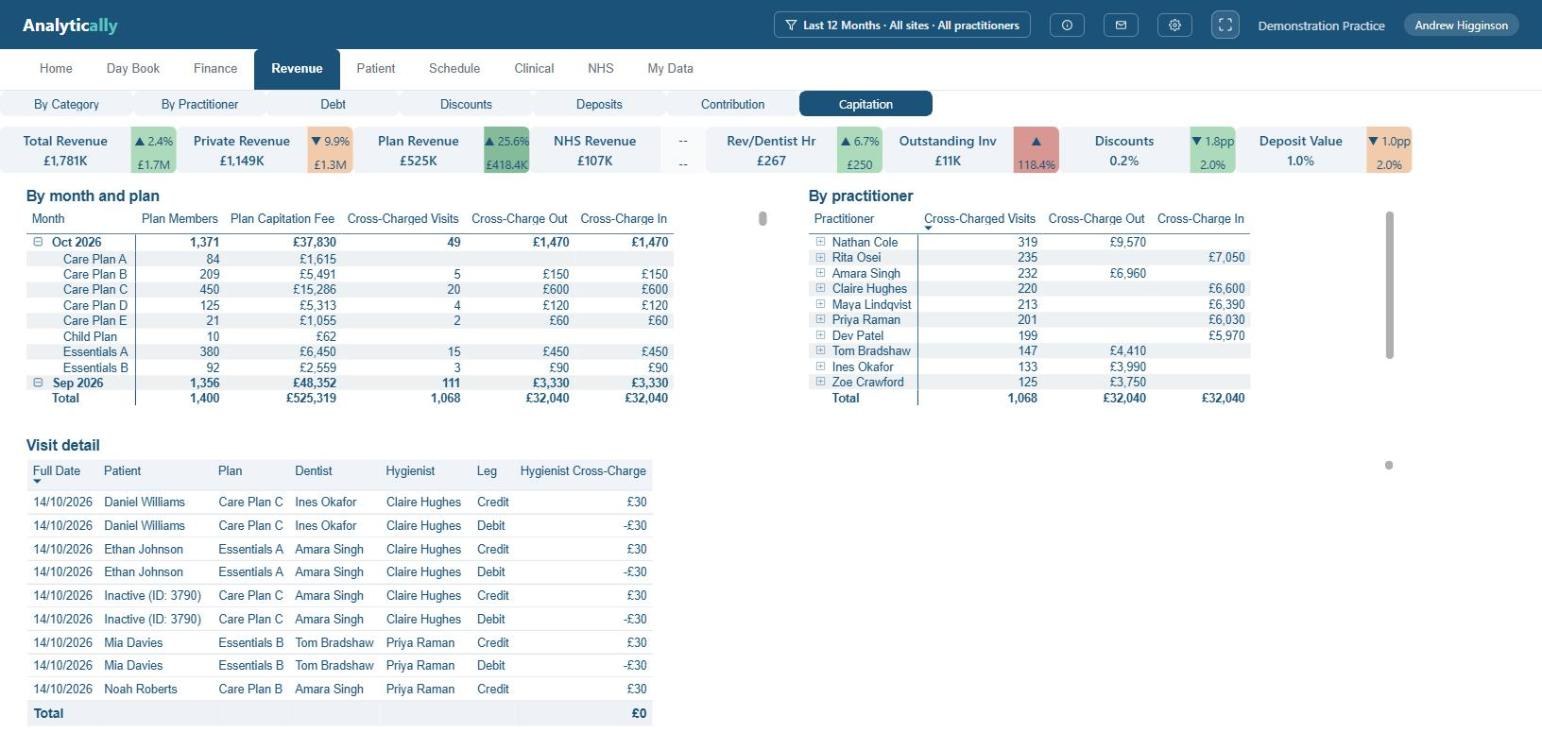
Membership is recorded in Dentally, by tier. Analytically holds the fee each tier earns, and whether there is a cross-charge between an associate and a hygienist for every hygiene plan visit.
Plan providers are generally low-tech; often the only thing they send is a monthly spreadsheet. Analytically reads the same money out of the clinical record instead, reconstructed from the patients holding plans in Dentally rather than from an invoice, and it reconciles to the provider’s remittance the following month. Having it early gives not only a true total revenue figure but a realistic revenue per clinical hour at clinician level.
123
1A complete month. 1,356 members, £48,352. About £35.66 each, which can be checked against the plan contract remittance.
2The cross-charge moves £30 a visit from dentist to hygienist. Without it the whole plan fee lands on the dentist and a hygienist’s revenue per hour cannot be calculated at all.
3The same money again by practitioner, which is what makes per-clinician profitability possible on plan patients, not only on fee-per-item work.
03
The whole practice on one screen
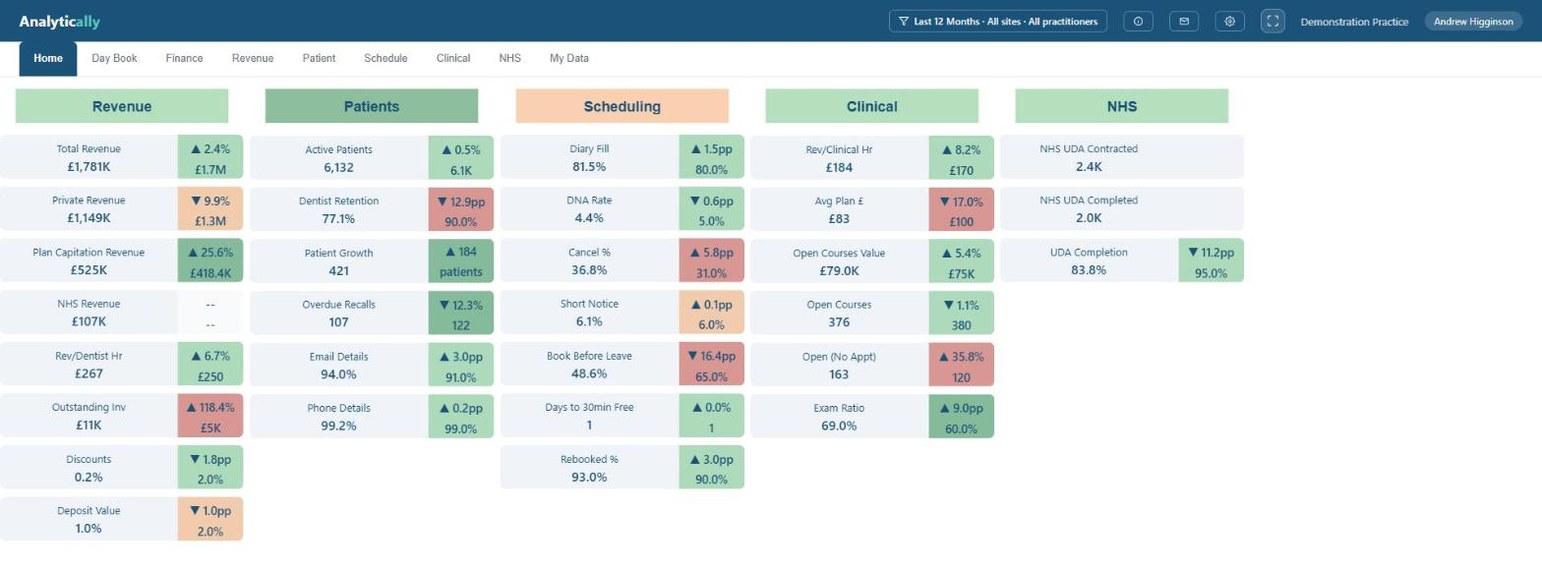
We jumped to revenue because that is often seen as THE key metric. But it is important to see the health of all areas at a glance. Analytically has a range of KPIs covering every aspect of the practice’s performance.
Start with the one number an owner would act on: Dentist Retention 77.1% against a 90% target. The standard remedy is to book the next appointment before the patient leaves the building, and that tile is on the same screen: Book Before Leave, 48.6% against 65%. In the same column, cancellations are already over target, and booking further ahead is what drives that number up. The next screen shows it happening. The clinical column reads the same way in money: Exam Ratio 69.0%, ahead of target, and 163 courses of treatment with no next appointment booked.
12345
1Dentist Retention 77.1% against 90%. The number that starts the conversation.
2Book Before Leave 48.6% against 65%. Half of patients walk out with no next appointment. This is the remedy, and it is the thing not happening.
3Cancellations 36.8% against 31%. Fix the tile below and this one gets worse before it gets better. The next screen is why.
4Exam Ratio 69.0%, ahead. The board is not uniformly bad. The diagnosis is being done.
5163 courses with no next appointment. Diagnosed, started, and nobody booked to finish it.
04
Pull one lever, and another bites back
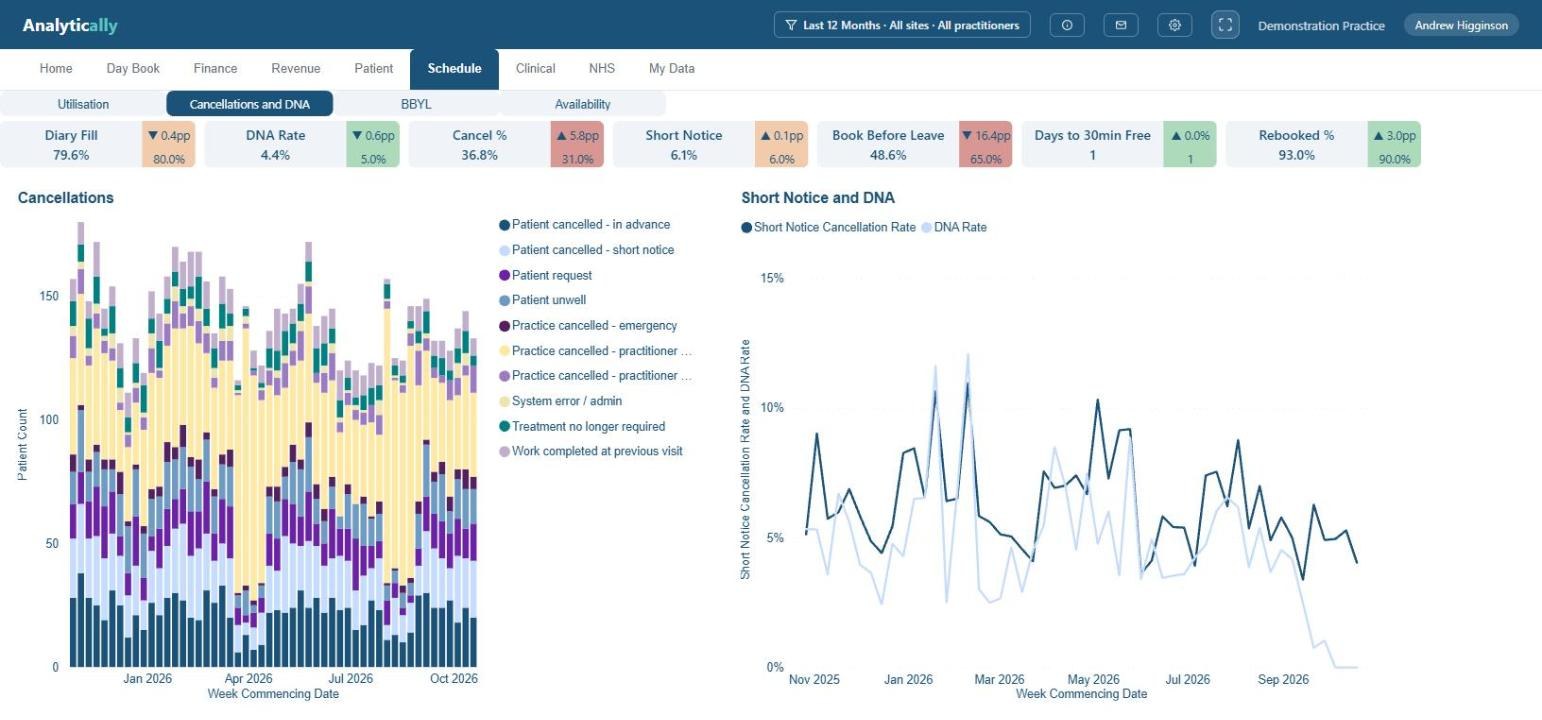
Half of this practice’s patients leave without booking a next appointment. The obvious remedy is to book them before they go, which means booking them six months out, before the clinician has booked their own leave.
Here is the consequence, in their data. The largest single cancellation reason is the practitioner, at about a third of all cancellations, and it is not evenly spread: roughly a quarter in most months, rising to 66% in August and 53% around Easter. That is school-holiday leave colliding with a diary booked months earlier. The improvement is causing part of the problem, and neither number is wrong. A rising cancellation rate here may be evidence that the booking discipline is working, which is not a conclusion any single metric can reach.
123
1The broad pale band running through every week is practice-cancelled, not patient-cancelled.
2The reasons separate who cancelled. That split is the finding; the headline rate on its own supports no action at all.
3August and Easter. The practitioner share doubles at Easter and more than doubles in August.
05
Associates are given freedom, but sometimes they need direction
Principals have a hard job coaching associates. They can set targets and explain how the practice likes things done, but the conversation still needs both people reading the same figures.
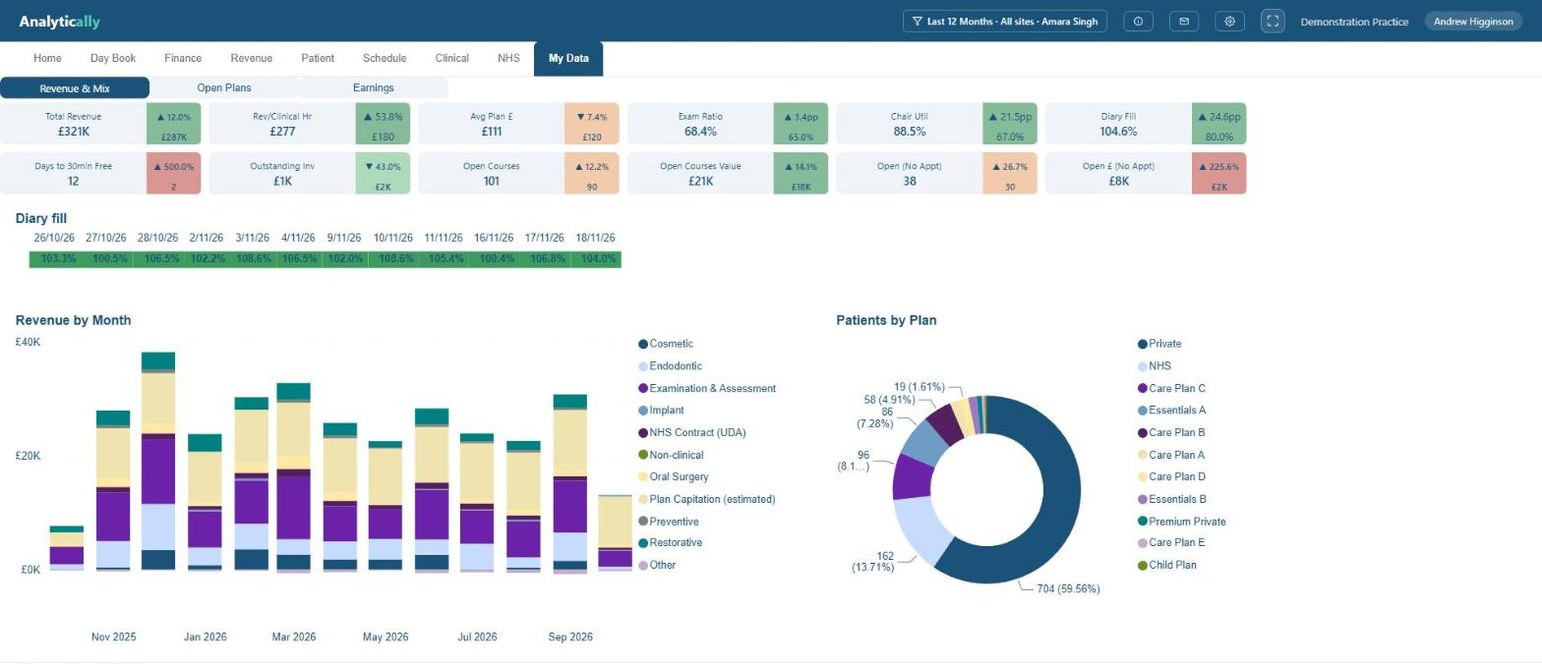
A subscription set up for an associate shows them their own figures and nothing else. There is no practice page behind this one, no finance page, no route through to a colleague’s numbers. The navigation is not hidden, it is not there.
By the measure most owners reach for first she is the strongest clinician in the practice: £277 an hour against a £180 target. The rest of the row is why that is not the whole story. Her diary is running at 104.6% of the hours she actually works, booked past the end of the day, every day. The next half-hour a patient can be offered with her is twelve days out, against a target of two. And 38 courses of treatment she has started have no next appointment booked, £8K of work begun and not finished.
1234
1£277 an hour against £180. On production she is the best in the practice, and she knows it.
2Diary fill 104.6%, and every working day on the strip below is at or over 100%. Booked past the hours she works, the overrun everyone feels and nobody had measured.
3Twelve days to her next half-hour slot, against a target of two. A patient who rings on Monday with something wrong waits a fortnight.
438 started courses with no next appointment. The work is half done and has no date on it, which is also £8K not yet invoiced.
What this means for the practice
The case is not that this practice is badly run. It is that it is run blind, by a clinician who was never given the instruments, on figures that are individually correct and collectively misleading.
Which puts the accountant in an odd position. You are the only business adviser most of these clients have, and you see them infrequently, on figures that are out of date, after every decision that mattered has already been taken. Not through anyone’s negligence, because that is the only cadence the information has ever allowed.
Analytically is not just a dashboard. It is a second opinion on your client’s own numbers, updated daily rather than annually: they get something they can act on between your meetings, and you get a client who arrives having already read them, and probably with informed questions.
Alongside the reporting there is a Day Book: named lists the practice can work from the same morning. Patients who failed to attend, cancellations waiting to be rebooked, recalls now due, and courses of treatment left open. Each one is a list of people to contact, not a number to interpret.
Setting it up takes a Dentally connection, optionally a Xero one, and about twenty minutes to enter the targets you would have recommended anyway.
What this means for you
There is a free month’s trial. At the end of it they can let it lapse or subscribe from £120 a month, which is twenty to thirty minutes of one clinician’s time.
On any practice you introduce we pay 20% of lifetime value as commission. The single-user version is £120 a month and we expect an average above £200, so twenty clients is roughly £8,000 to £10,000 a year to the firm.
If you would like to see it working, contact partners@analytically.info.
 1
2
3
4